Dupont Analysis is a powerful financial tool that provides a deeper insight into the performance of a company by breaking down its return on equity (ROE) into its component parts. Developed by the Dupont Corporation in the 1920s, this analytical technique has since become a staple in financial analysis, helping investors, managers, and analysts better understand the drivers behind a company’s profitability. In this article, we delve into what Dupont Analysis entails, how to conduct it, its advantages, examples of its application, implications for decision-making, and its limitations.
What is Dupont Analysis?
Dupont Analysis, also known as the Dupont Identity or Dupont Model, is a method used to decompose a company’s ROE into its constituent elements. ROE is a key financial metric that measures a company’s profitability by indicating how much profit is generated relative to its shareholders’ equity. This ratio represents return on equity capital invested in the company. It shows a company’s ability to convert its equity investment into profits
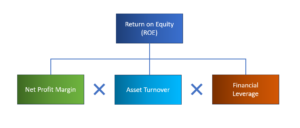
Dupont Analysis breaks down ROE into three components:
- Net Profit Margin: This represents the profitability of the company’s operations and is calculated by dividing net income by total revenue. It indicates how efficiently a company is able to convert sales into profits.
Net Profit Margin = (Net Profit/ Revenues) x 100
Net profit is the profit available for shareholders after paying all expenses and taxes.
Revenue is the total sales generated during a particular period.
Example: If a company has a net profit of $50,000 and revenue of $500,000, the net profit margin would be 10% (($50,000 / $500,000) x 100). This means that 10% of the company’s revenue is converted into net profit.
2. Asset Turnover: This measures how efficiently a company utilizes its assets to generate sales. It is calculated by dividing total revenue by average total assets.
Asset Turnover Ratio=Net Revenues/ Average Total Assets
Example: If a Company has revenues of $500,000 and Total Assets of $1,000,000, its Asset Turnover ratio is 2x.
Asset Turnover Ratio=($5,00,000/$1,000,000) = 0.5x
In this example, the asset turnover ratio is 0.5x. This means that, on average, Company generates $0.5 in sales for every $1 invested in total assets.
3. Financial Leverage: This reflects the degree of financial leverage employed by the company, indicating the proportion of debt used to finance its operations relative to equity. It is calculated by dividing average total assets by average shareholders’ equity.
Financial Leverage = Average Total Assets/Average Shareholders Equity
Example: If a company has a Total Average Assets of $1,000,000 and Average Equity Investment of of $500,000, the Financial leverage would be 2 ($1,000,000/ $500,000) .
The formula for Dupont Analysis can be expressed as follows:

ROE = Profit Margin × Asset Turnover × Financial Leverage

In the above Example, the ROE of the Company = 10%*0.5*2 = 10%
Steps for Conducting Dupont Analysis
Conducting Dupont Analysis involves several steps:
- Gather Financial Data: Collect the necessary financial statements, including the income statement and balance sheet, for the period you wish to analyze.
- Calculate Profit Margin: Divide net income by total revenue to determine the profit margin.
- Calculate Asset Turnover: Divide total revenue by average total assets to calculate asset turnover.
- Calculate Financial Leverage: Divide average total assets by average shareholders’ equity to calculate financial leverage.
- Multiply the Components: Multiply the three components—profit margin, asset turnover, and financial leverage—together to calculate ROE.
Advantages of Dupont Analysis
Dupont Analysis offers several advantages:
- Comprehensive Insight: By breaking down ROE into its components, Dupont Analysis provides a more comprehensive understanding of the factors driving a company’s profitability.
- Identification of Strengths and Weaknesses: It helps identify specific areas where a company excels or lags, enabling management to focus on improving performance in key areas.
- Peer Comparison : Dupont Analysis allows for easy comparison between companies within the same industry or over time, facilitating benchmarking and performance evaluation.
- Diagnostic Tool: It serves as a diagnostic tool for identifying the root causes of changes in ROE, helping management make informed decisions to enhance shareholder value.
Implications of Dupont Analysis
Dupont Analysis has several implications for decision-making:
- Strategic Planning: It informs strategic planning by highlighting areas of improvement to enhance profitability, such as increasing profit margins, optimizing asset utilization, or adjusting the capital structure.
- Performance Evaluation: It aids in evaluating the effectiveness of management decisions and operational performance by dissecting ROE into its underlying drivers.
- Capital Allocation: Dupont Analysis assists in allocating capital more efficiently by identifying investments that generate higher returns on equity.
- Risk Management: It helps in assessing the impact of various risk factors, such as changes in profit margins or asset turnover, on overall profitability and shareholder value.
Limitations of Dupont Analysis
Despite its usefulness, Dupont Analysis has certain limitations:
- Data Availability: It relies on accurate and consistent financial data, which may not always be readily available, especially for private companies or those operating in multiple jurisdictions.
- Interdependency: The components of Dupont Analysis are interdependent, meaning changes in one component may affect others, making it challenging to isolate the impact of individual factors.
- Industry Specificity: Dupont Analysis may not be equally applicable across all industries, as different industries have varying business models, cost structures, and capital requirements.
Conclusion
Dupont Analysis is a valuable tool for dissecting a company’s ROE and gaining insights into its profitability drivers. By breaking down ROE into its component parts—profit margin, asset turnover, and financial leverage—it provides a holistic view of a company’s performance. While it offers numerous advantages, such as comprehensive insight and performance evaluation, it is important to consider its limitations and use it judiciously in conjunction with other financial analysis techniques. Ultimately, Dupont Analysis equips investors, managers, and analysts with the necessary tools to make informed decisions and enhance shareholder value.


Pingback: Financial Ratios Analysis - corpfinanceinsights.com