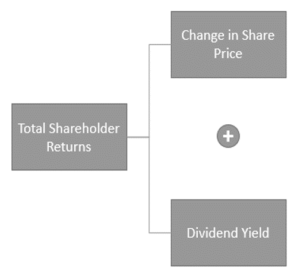
Total Shareholders Return (TSR) is a key financial metric used by investors to evaluate the profitability and performance of their investments in a particular company over a specified period. TSR takes into account both capital appreciation (changes in stock price) and dividends paid to shareholders. It provides a comprehensive view of the overall return generated by an investment, incorporating both income generated from dividends and capital gains (or losses) from changes in stock price.

How is Total Shareholders Return (TSR) calculated?
TSR is calculated using the following formula

Where
P1 = Share price at the end of the year
P0 = Share price at the beginning of the year
Let’s say you invested in Company XYZ on January 1st, 2023, and sold your shares on December 31st, 2023. During this period, you received dividends of $2 per share.
- Starting price of Company XYZ stock (P0) on January 1st, 2023: $50 per share
- Ending price of Company XYZ stock (P1) on December 31st, 2023: $60 per share
- Dividends received per share during 2023: $2 per share
Using the TSR formula:
Total Shareholder Return = (60-50+2)/50 = 12/50 = 24%
This means that your investment in Company XYZ generated a return of 24% over the course of the year, considering both capital appreciation (increase in stock price) and dividends received.
Drivers of Total Shareholders return (TSR)
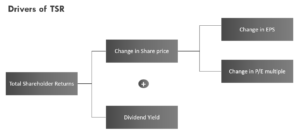
Total Shareholders Return (TSR) provides a comprehensive measure of the profitability of an investment, capturing both capital appreciation and dividends received. However, when we delve deeper into TSR analysis, we discover that it is composed of three key components: changes in Earnings per Share (EPS), variations in Price-to-Earnings (P/E) multiple, and Dividend Yield.

Change in Earnings per Share (EPS)
Earnings per Share (EPS) is a fundamental metric that reflects a company’s profitability on a per-share basis. The change in EPS over a specific period can significantly impact TSR. An increase in EPS typically leads to higher stock prices, driving capital appreciation and enhancing TSR. Conversely, a decline in EPS may result in decreased stock prices and lower TSR.
Companies with consistent earnings growth tend to attract investors’ attention and drive stock prices higher, contributing to higher TSR.
Change in Price-to-Earnings (P/E) Multiple
The Price-to-Earnings (P/E) multiple is a valuation metric used to assess how much investors are willing to pay for each dollar of a company’s earnings. Changes in the P/E multiple can influence TSR independently of EPS. If investors become more optimistic about a company’s future prospects, they may be willing to pay a higher multiple of earnings, leading to an increase in stock price and higher TSR. Conversely, a decrease in the P/E multiple may result in lower stock prices and reduced TSR, even if EPS remains constant.
Dividend Yield
Dividend Yield is the ratio of dividends paid per share to the stock price. It represents the annual return on investment from dividends alone. Dividend yield is important to calculate TSR. However, it is not a driver of TSR.
Corporates distribute dividends using cash generated from business operations after fulfilling capital expenditure obligations and settling financial liabilities. A company prioritizing investment for future expansion may lack available cash for dividend payouts, yet it can achieve a high Total Shareholder Return (TSR) due to current growth investments leading to anticipated future cash flows, which in turn drive higher valuations based on investor expectations.
Conversely, a company operating in a mature industry like Utility may experience limited growth prospects despite having significant cash flows. In such cases, these companies often opt to distribute high dividends to shareholders rather than retaining cash, given the constrained growth opportunities. Consequently, the TSR for such companies tends to remain relatively stable, as investors anticipate minimal improvement in earnings growth.
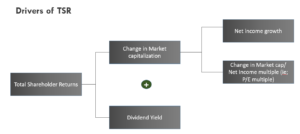
If we multiply share price and EPS by the total no. of outstanding shares, we get the TSR at Company level
TSR = Change in Market Capitalization + Dividend Yield

To comprehend the drivers behind a company’s Total Shareholders Return (TSR) performance, it’s essential to delve into the factors influencing net income growth and multiples. These factors, in turn, shape the trajectory of TSR, reflecting the overall health and potential of the investment. Let’s explore how various elements impact net income growth and multiples, thereby influencing TSR.
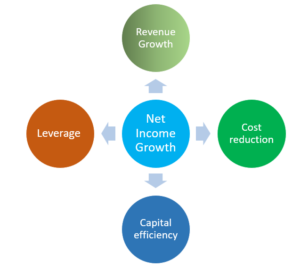
Net Income Growth: Net Income or earnings growth serves as a cornerstone for bolstering TSR. Several key drivers contribute to this growth.

- Revenue Growth: Expanding top-line revenue is a primary driver of earnings growth. Companies can achieve revenue growth through market expansion, product innovation, strategic acquisitions, or capturing market share from competitors.
- Cost Reduction/Margin Increase: Efficient cost management and margin expansion directly contribute to earnings growth. Companies can achieve this through operational efficiencies, supply chain optimization, or pricing strategies that enhance profitability.
- Capital Efficiency: Maximizing the efficiency of capital deployment is crucial for driving earnings growth. Efficient use of resources, prudent investment decisions, and effective asset management can amplify returns on invested capital and bolster earnings.
- Leverage: Strategic use of leverage can magnify returns and boost earnings growth. However, excessive leverage poses risks and can erode profitability if not managed prudently.
Multiples: Multiples, such as the Price-to-Earnings (P/E) ratio, Price-to-Sales (P/S) ratio, or Price-to-Book (P/B) ratio, reflect market sentiment and investors’ perceptions of a company’s future prospects. Several factors influence these multiples.
- Growth Prospects: Companies with robust growth prospects often command higher multiples as investors anticipate future earnings growth. Factors such as industry trends, competitive positioning, and innovation capabilities influence growth expectations.
- Risk Profile: The perceived risk associated with a company impacts its multiples. Companies with stable cash flows, strong balance sheets, and consistent earnings growth typically command higher multiples, reflecting lower perceived risk.
- Market Sentiment: Investor sentiment, market conditions, and macroeconomic factors can sway multiples. Positive sentiment and favorable market conditions may drive multiples higher, while economic uncertainty or sector-specific challenges may depress multiples.
- Quality of Earnings: The sustainability and quality of earnings play a vital role in determining multiples. Companies with transparent financial reporting, consistent earnings growth, and a track record of delivering on their financial commitments often command premium multiples.
The interplay of factors influencing net income growth and multiples shapes a company’s TSR performance. By focusing on drivers such as revenue growth, cost management, capital efficiency, and leverage, companies can foster earnings growth and enhance shareholder value. Similarly, understanding the determinants of multiples and proactively managing these factors can attract investor interest and bolster TSR. In essence, a comprehensive understanding of these dynamics enables investors to evaluate the growth potential and value proposition of investments, ultimately driving superior TSR outcomes.
Reference: Mckinsey Article A better way to understand TRS


Pingback: Mastering Cash Flow Management: A Key to Business Success - corpfinanceinsights.com
Pingback: Understanding Negative Cash Conversion Cycle: Implications and Examples