Financial statement analysis holds paramount importance as a critical imperative for stakeholders seeking insights into a company’s overall health and performance. This analytical process involves a comprehensive examination of a company’s financial statements, unveiling crucial information that aids in informed decision-making and strategic planning. Financial statements serve as the bedrock of this analysis, providing a window into the inner workings of a company. In this dynamic arena, where market dynamics fluctuate and economic landscapes evolve, the ability to decipher financial statements becomes a cornerstone for making informed and strategic decisions.
This article aims to unravel the complexities of financial statements and guide analysts and other stakeholders in evaluating a company’s performance, growth prospects, margins, returns, leverage, and overall financial health.
Types of Financial Statements
There are three types of financial statements which Companies must report periodically. They are
- Income Statement
- Balance sheet
- Cash flow statement
Income Statement (Profit and Loss Statement
The income statement is a snapshot of a company’s revenues, expenses, and profits over a specific period. It showcases the ability of a company to generate profits from its core operations. Analysts often look at the top line (revenue), operating income (EBIT), and net income (profit after tax) to gauge the profitability of a company.
Corporates are required to file their income statement with the regulatory authorities on a periodic basis (quarterly and annually).
Example
Commencing operations on January 1, 2023, with a capital of $1,000, XYZ Corp. initiated a venture focused on retailing mobile phones. The company acquired 10 mobiles from its suppliers at a cost of $90 each, subsequently selling them for $200 each. By the month’s end, all mobiles were sold, and there was no closing inventory. In addition to the mobile procurement costs, a supplementary expense of $100 was incurred for marketing purposes. Here is how the Profit and Loss Statement for XYZ Corp would look like at the end of the month.
Profit and Loss account of XYZ Corp for the period 01st Jan 2023 to 31st January 2023
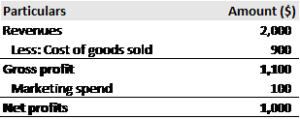
Revenue is the amount received on sale of goods. Revenue is also referred to as Sales, Turnover or Top line.
- In our example, XYZ Corp sold 10 mobiles @ $200 each. Hence, his total revenue for XYZ Corp is $2,000.
Cost of goods sold (COGS) is the price paid for acquiring goods and services. COGS include all the direct costs (Labour, material, overheads etc.) associated with acquisition/manufacturing of goods and services.
- In our example, XYZ Corp purchased 10 mobiles @ $90 each. Hence the total purchase cost or Cost of goods sold is $900.
Gross profit is the profit after deducting the cost of goods sold from total revenues/ sales generated during a period.
Gross profit = Revenues – Cost of goods sold.
Marketing Spend is a spend associated with sales of products and services. This is considered as an indirect spend. Indirect expenses are included in the income statement below the Gross profit.
In the above example, XYZ Corp incurred a marketing spend of $100. Hence, it is included as an indirect expense in the income statement.
Net income is the profit generated by a Company after accounting for all expenses. In this example, it is $1000.
For simplicity, we have ignored the interest cost and taxes for calculating the net income.
Balance Sheet
The balance sheet provides a snapshot of a company’s financial position at a specific point in time. It comprises assets, liabilities, and equity. Analysts examine the liquidity and solvency of a company by scrutinizing its current assets, liabilities, and the overall debt-equity ratio.
Total Assets = Total Liabilities + Equity
This means that assets invested in the business are financed by liabilities (Operating liabilities and Debt) and Equity.
Example
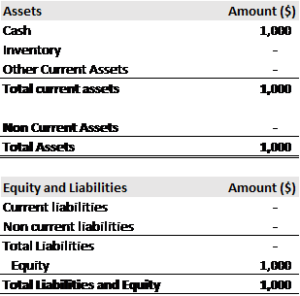
Extending the scenario, assuming that XYZ Corp invested $1,000 in equity at the inception of the business, the balance sheet on January 1, 2023, would present the following financial snapshot for XYZ’s business:
Balance sheet of XYZ Corp as on 1st Jan 2023
Let us briefly understand the balance sheet items.
Current assets are those assets which can be converted into cash within one year. They include: Cash and cash equivalent, Trade receivable, Inventory, prepaid expenses etc.
Non-current Assets include assets such as Property plant and equipment, Long term investments etc. which cannot be converted into cash (during the normal course of operations) within one year.
Total Assets is a sum of current and non-current assets
Current Liabilities are those liabilities which are expected to be paid within one year. These liabilities include: Trade payables/ creditors, Short term outstanding expenses, Short term debt etc.
Non-current liabilities are those liabilities which are expected to be paid after one year. It includes Long term debt, Pension, Post-retirement benefit liabilities etc.
Equity is the amount invested in the business by its owners.
Equity = Total Assets – Total Liabilities
Now coming back to our example, In the initial state, the business’s assets consist solely of $1,000 in cash, representing the equity investment made by XYZ Corp.
Once XYZ Corp buys the mobiles for $900 his balance sheet will look as under.
Balance sheet of XYZ Corp as on 1st Jan 2023
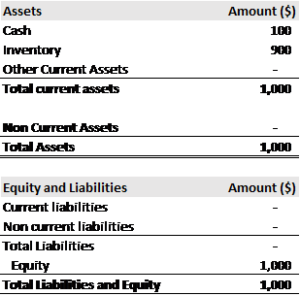
$1,000 cash gets reduced to $100, as XYZ Corp paid $900 for purchasing the inventory (mobiles).
In the next one month, XYZ sells off all the inventory and earns a net profit of $1000. The balance sheet on 31st January 2023 will look like this.
Balance sheet of XYZ Corp as on 31st Jan 2023.
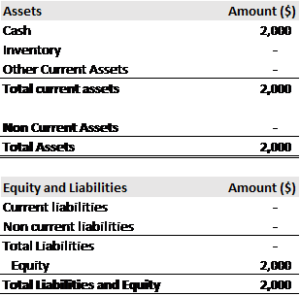
The inventory gets converted to revenues of $2,000. Out of which XYZ Corp pays $100 for marketing spend. That means the cash balance would increase by $1,900.
Closing cash balance for XYZ would be $100 + $2,000 – $100 = $2,000
Inventory gets reduced to NIL.
Equity increases by $1,000 which is the net profit earned during the period.
Closing Equity = Opening Equity + Net profit
Closing Equity = $1,000 + $1000 = $2,000
Cash Flow Statement
The cash flow statement outlines the inflow and outflow of cash and cash equivalents during a specific period. It is divided into operating, investing, and financing activities. Analysts assess a company’s ability to generate cash, meet obligations, and invest in future growth.
Cash Flows from Operating Activities (CFO):
CFO stands out as the most critical segment of the cash flow statement. It meticulously outlines the cash generated or used by a company’s core business operations. This section provides insights into the company’s operational efficiency and its capacity to generate consistent cash inflows from its day-to-day activities.
Cash Flows from Investing Activities (CFI):
CFI encompasses the cash transactions associated with a company’s investments in assets, both tangible and intangible, intended to foster future growth. This section reflects the capital expenditures made by the company for acquiring property, equipment, or other long-term assets.
Cash Flows from Financing Activities (CFF):
CFF encapsulates the cash transactions related to a company’s capital structure. This includes the issuance and repayment of debt, as well as transactions involving equity, such as stock issuances or buybacks. The financing activities section illuminates how a company funds its operations and expansion.
Example – Let’s delve into the cash flow statement of XYZ Corp on January 1, 2023, before the mobile purchase:
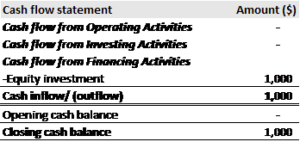
There is no cash flow from Operating and Investing Activities. XYZ Corp has financed its business with $1000 equity. Hence cash flows from Financing Activities would be positive $1000.
Opening cash is NIL and closing cash is $1,000 funded in the business.
Now, once XYZ Corp purchases the mobiles, its cash flow statement would look like this.
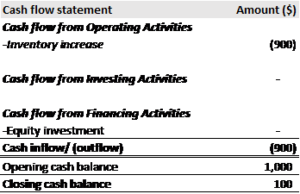
$900 used in purchasing mobiles is a cash outflow for XYZ Corp from Operating Activity. Closing cash left in the business is $100.
At the end of the month, XYZ Corp’s cash flow statement would look like this.
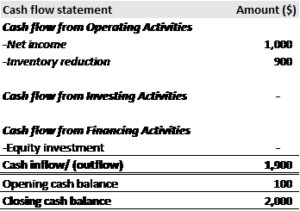
$1000 earned in the business or net income is a cash inflow from operating activity. The inventory during this period reduced to NIL (see balance sheet above). This decrease is a cash inflow of $900 for the business.
Summing these two up give the cash flow from operations, which is $1,900.
This when added to the opening cash balance gives the closing cash balance of XYZ Corp : i.e. $2000/-. This balance should match with what we have in the balance sheet.
Learn about Discounted cash flow Valuation
Analysing Financial Performance
Financial statement analysis is a systematic process of reviewing and evaluating a company’s financial statements to extract meaningful insights about its financial performance, health, and future prospects. This analysis is crucial for various stakeholders, including investors, creditors, analysts, and management, as it helps them make informed decisions and understand the overall financial well-being of the entity. Here are a few performance indicators.
- Revenue Growth and Profit Margins – Analysts delve into the income statement to assess a company’s revenue growth and profit margins. Consistent revenue growth indicates market acceptance and a competitive edge. Examining operating and net profit margins reveals how efficiently a company converts revenue into profit.
- Return on Investment (ROI) and Return on Equity (ROE) – Return metrics help gauge the effectiveness of capital utilization. ROI considers the return generated from all investments, while ROE focuses on returns relative to shareholders’ equity. A rising ROI and ROE suggest effective capital deployment.
- Leverage and Debt Management – The balance sheet aids in evaluating a company’s leverage. The debt-to-equity ratio indicates the proportion of debt used to finance operations. Low leverage signifies financial stability, while excessive debt may raise solvency concerns.
- Liquidity and Working Capital Management – The current ratio (current assets divided by current liabilities) and quick ratio (excluding inventory) gauge a company’s liquidity. A healthy liquidity position ensures the ability to meet short-term obligations, while efficient working capital management enhances operational efficiency.
- Cash Flow and Operating Efficiency – Cash flow statements unveil a company’s ability to generate cash. Positive operating cash flow indicates healthy operational performance. Analysts look for consistent positive cash flows and efficient management of working capital.
Key Considerations
- Industry Benchmarking: Compare financial ratios with industry benchmarks for a holistic perspective. Industries exhibit distinct financial dynamics; thus, benchmarking provides context.
- Trend Analysis: Assess financial statements over multiple periods to identify trends. Consistent positive trends suggest stability and effective management.
- Risk Assessment: Analyze potential risks such as market volatility, regulatory changes, and economic downturns. Companies with robust risk management strategies exhibit resilience.
- Quality of Earnings: Scrutinize the source of earnings. Sustainable profits from core operations are more reliable than one-time gains.
- Management Discussion and Analysis (MD&A): Complement financial statements with management’s insights. MD&A offers qualitative information, providing a more comprehensive understanding.
Conclusion
Financial statement analysis is a nuanced art that requires a comprehensive understanding of a company’s financial intricacies. By dissecting income statements, balance sheets, and cash flow statements, analysts gain insights into a company’s past performance and future potential. Remember, the numbers tell a story, and decoding that narrative is the key to making informed investment decisions.
.


Pingback: From Data to Decisions: Harnessing Fundamental Analysis for Profitable Investments - corpfinanceinsights.com