In the realm of strategic management, businesses constantly grapple with the challenge of allocating resources effectively to their various products or services. Amidst this complex decision-making process, the Boston Consulting Group (BCG) Matrix emerges as a beacon of clarity, providing a structured framework for evaluating and prioritizing investments. Originally developed by Bruce Henderson in the early 1970s, the BCG Matrix remains a cornerstone tool for portfolio analysis, aiding businesses in assessing the performance and potential of their offerings. Let’s delve into what the BCG Matrix entails, its components, and how it can drive strategic decisions, with illustrative examples.
Understanding the BCG Matrix

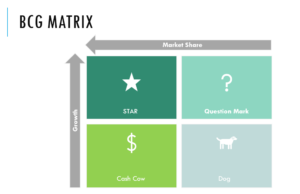
At its core, the BCG Matrix classifies a company’s products or services into four distinct categories based on two dimensions: market growth rate and relative market share. These dimensions serve as proxies for a product’s attractiveness and competitive position within its respective market.
- Stars: Products occupying this quadrant boast a high market share in rapidly growing markets. Stars typically necessitate substantial investment to sustain their growth momentum. As market leaders, they contribute significantly to a company’s revenue and profitability. However, they also consume substantial resources to maintain their competitive edge. The goal for businesses is to nurture Stars into becoming future cash cows.
- Cash Cows: In this quadrant reside products with a dominant market share in mature, slow-growing markets. Cash cows generate substantial cash flows due to their established position, but their growth potential is limited. Since they require minimal reinvestment, cash cows serve as reliable sources of revenue, contributing to a company’s financial stability. Businesses often milk cash cows by maximizing profitability without significant additional investments.
- Question Marks (or Problem Children): Question marks represent products operating in high-growth markets but holding a relatively low market share. These offerings possess the potential to become Stars if strategically nurtured. However, they require careful consideration and investment decisions due to their uncertain future. Businesses must decide whether to invest resources to capture market share or divest from these products if growth prospects are deemed unfavorable.
- Dogs: Dogs, situated in the fourth quadrant, occupy low-growth markets with a meager market share. These products neither generate substantial cash flows nor hold significant growth potential. Businesses often face the decision to divest or reposition dogs to prevent further resource drain and focus on more promising ventures.
Horizontal Axis (Market Growth Rate): The horizontal axis of the BCG Matrix represents the market growth rate, indicating the rate at which the market for a particular product or service is expanding. This axis typically ranges from low to high growth rates.
-
- Low Growth Rate: Indicates markets experiencing slow or stagnant growth, often characterized by mature or declining industries.
- High Growth Rate: Represents markets undergoing rapid expansion, with ample opportunities for new entrants and product innovation.
Vertical Axis (Relative Market Share): The vertical axis of the BCG Matrix depicts the relative market share of a product or service within its respective market segment. Relative market share compares a company’s market share with that of its competitors, highlighting its competitive position.
-
- Low Relative Market Share: Signifies products with a small share of the market compared to competitors, suggesting weaker competitive positioning.
- High Relative Market Share: Indicates products holding a substantial share of the market relative to competitors, reflecting stronger competitive positioning and market dominance.
Example
Let’s consider a hypothetical conglomerate, ABC Holdings, which operates in various industries including technology, healthcare, consumer goods, and energy. Here’s how we can classify its businesses into different quadrants of the BCG Matrix:
- Stars: ABC Holdings’ technology division has recently launched a revolutionary artificial intelligence (AI) platform that is gaining significant traction in the market. Despite being a relatively new entrant, the AI platform has quickly captured a substantial market share in the rapidly growing AI software industry. Due to its innovative features and high demand, the technology division’s AI platform qualifies as a Star in the BCG Matrix. It requires substantial investment to maintain its growth momentum and fend off competitors.
- Cash Cows: Within the conglomerate’s healthcare segment, ABC Holdings owns a chain of well-established hospitals and clinics. Despite the healthcare industry experiencing modest growth, the hospitals maintain a dominant market position in their respective regions. As trusted healthcare providers with a loyal patient base, these hospitals generate consistent cash flows and profitability for the conglomerate. Therefore, the healthcare division’s hospital chain qualifies as a Cash Cow in the BCG Matrix, requiring minimal reinvestment while continuing to yield substantial returns.
- Question Marks: ABC Holdings’ consumer goods division has recently introduced a new line of organic food products targeted at health-conscious consumers. Although the organic food market is experiencing rapid growth, the conglomerate’s products have yet to gain significant market share due to intense competition from established brands. However, the organic food market shows promise for future growth. Therefore, the consumer goods division’s organic food line falls under the Question Marks category in the BCG Matrix, indicating potential for growth but requiring strategic investment to improve market share.
- Dogs: In the energy sector, ABC Holdings operates a traditional coal-based power generation subsidiary. However, with increasing emphasis on renewable energy sources and environmental sustainability, the demand for coal-based power has been steadily declining. Despite efforts to optimize operations, the subsidiary struggles to maintain profitability and faces uncertain future prospects. As a result, the coal-based power generation business qualifies as a Dog in the BCG Matrix, operating in a low-growth market with a low relative market share.
By classifying its businesses into different quadrants of the BCG Matrix, ABC Holdings can gain insights into the performance and potential of each division within its diverse portfolio. This classification enables the conglomerate to allocate resources strategically, prioritize investments, and optimize its overall portfolio management approach to drive sustainable growth and profitability across its businesses.

